
New Manager: Invesco S&P International Developed Quality ETF (IDHQ)
Systematic focus on high-quality international stocks but with better execution
Growth stocks in Europe and Japan. Overlap with high-quality, but quality delivers more consistent results.
$1.0 Billion Total Fund Assets
Well established with strong liquidity. ETF Structure means no expected capital gain distributions
Cost savings of 0.26%
0.29% Expense Ratio
2.3% Yield
vs 1.9% for Harbor1
The Quality Methodology — Three Pillars
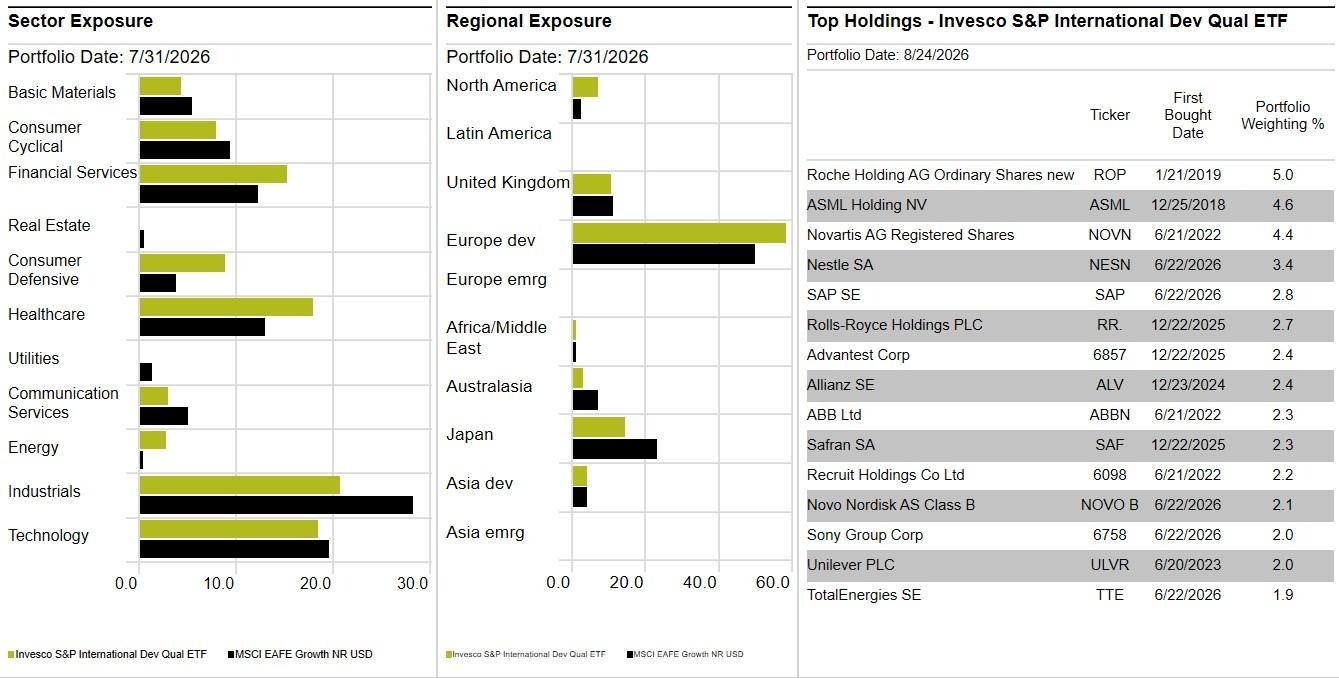
The new fund (IDHQ) screens for a combination of profitability, accounting quality and balance sheet strength.
| Profitability Companies that earn strong, sustained returns on the capital shareholders have invested. Measured by Return on Equity | Accounting Quality Earnings backed by cash flow rather than accounting estimates and non-cash adjustments. Measured by Accruals Ratio | Balance Sheet Strength Conservative capital structures that rely less on debt to fund the business. Measured by Financial Leverage Ratio |
| Combined into a single quality score. Companies ranking in the top 20% in all three pillars together are selected and weighted by market cap. Security weights are capped at 5% with a maximum of 40% in any single sector or country | ||
Recommendation
Terminate OSEA and reallocate the proceeds to IDHQ growth-focused developed international position. The change replaces manager-specific risk with a transparent, rules-based quality portfolio at a lower all-in cost.
What This Means for You
- A cleaner core: OSEA’s shortfall came from stock selection rather than market conditions, and IDHQ delivers the same quality exposure through a transparent, rules-based portfolio.
- Maintaining exposure through an ETF helps avoid the large-cap gain distributions expected across international growth funds this year.
- Manageable capital gains due to shorter holding period and smaller allocation
- Bloomberg forward 12-month estimate, gross of fees
Source: Paul Comstock Partners analysis; attribution and holdings data as presented in this review. Past performance is not a guarantee or reliable indicator of future results.
Performance
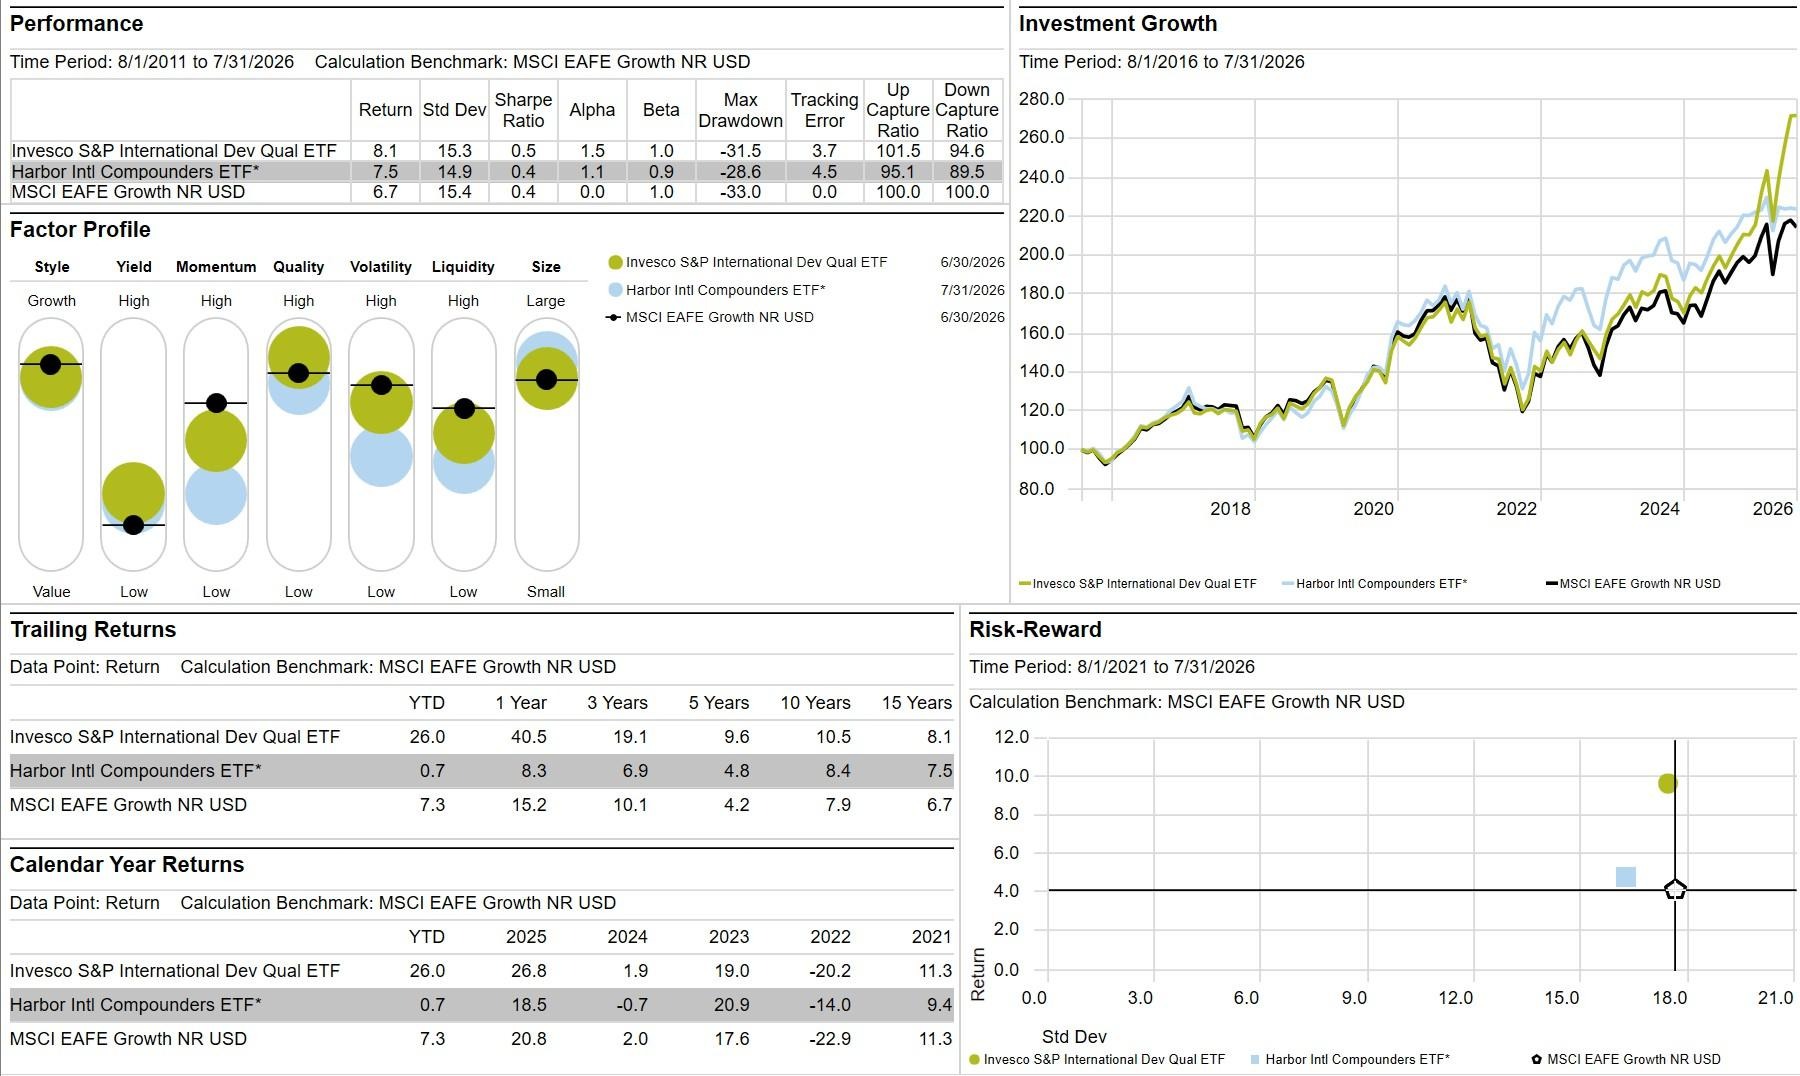
Portfolio Data
Index Definitions: US Equity
Indexes are not available for direct investment
Index performance is presented for illustrative purposes and not intended to imply the performance of any fund or investment. Index performance assum es reinvestment of all income and dividends.
S&P 500
The S&P 500 represents large cap US stocks and consists of 500 companies selected by a committee to be most representative of the US market as a whole.
Russell US Equity Indexes
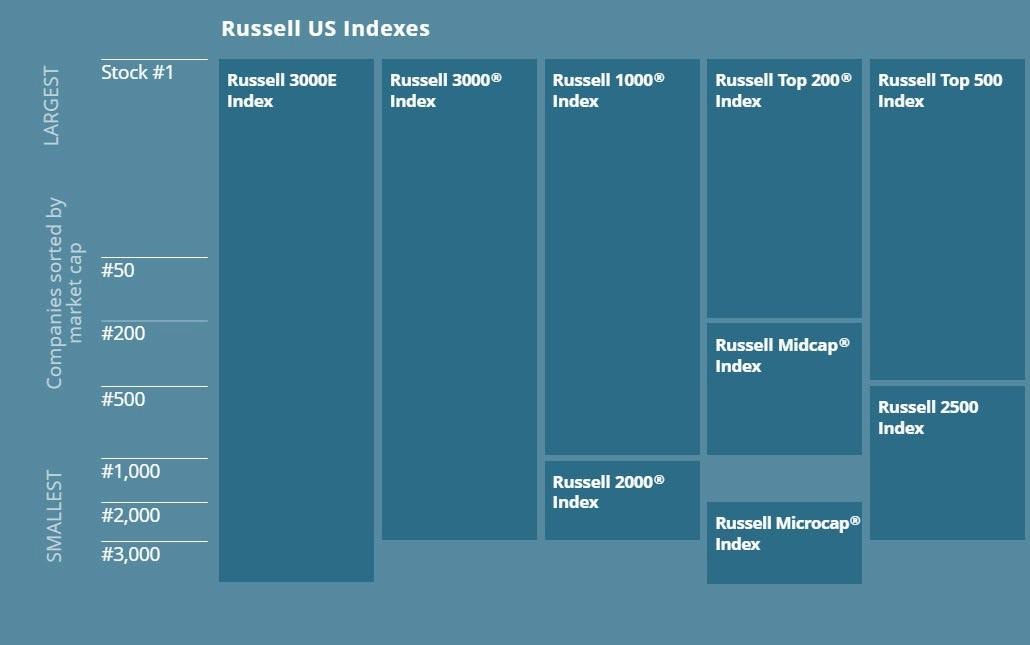
Russell constructs its US indexes by ranking US domiciled publicly traded companies by their market capitalization (the aggregate value of outstanding shares). The Russell 3000E encompasses the broad US market with the largest 4000 US companies and covers approximately 99% of the US equity market’s total value. More commonly used, the Russell 3000 includes the largest 3000 US companies and covers approximately 98% of the total capitalization of the US equity market. The 1000 largest public com panies comprise the Russell 1000 Index, which represents large and mid cap stocks with the bottom 2000 stocks encompassing the Russell 2000 Small Cap Index. Large and mid cap stocks within the Russell 1000 Index can be broken out into the Russell Top 200 Index of large cap stocks and the Russell Midcap Index, which contains the remaining 800 stocks of the 1000. Finally, small and mid cap stocks are combined in the Russell 2500 Index which consists of the Russell 2000 Index and the smallest 500 names of the Russell 1000.
Value and Growth Indexes are created by Russell for each index listed above. The methodology consists of ranking all stocks bas ed on book-to-price (B/P) ratio, I/B/E/S forecast medium-term growth (2-year), and sales per share historical growth (5-year). Based on these ranks, the market capitalization is divided equally between value and growth. Stocks may have their market capitalization split between the two indexes. For example, it is possible a company could have 30% of its market cap assigned to the Russell 1000 Value Index and the remaining 70% of its market cap represented in the Russell 1000 Growth Index.
Index Definitions: Non-US Equity
Indexes are not available for direct investment
Index performance is presented for illustrative purposes and not intended to imply the performance of any fund or investment. Index performance assumes reinvestment of all income and dividends. Returns for non-US stocks are net of dividend taxes withheld by the respective countries in which the company is domiciled.
MSCI International Equity Indexes
The MSCI EAFE Index attempts to repres ent the performance of large and mid-cap stocks across 21 developed markets, excluding the United States and Canada. The index is capitalization-weighted and included over 900 companies
The MSCI EAFE Small Cap Index contains over 2300 companies and represents the performance of smaller companies within the EAFE countries.
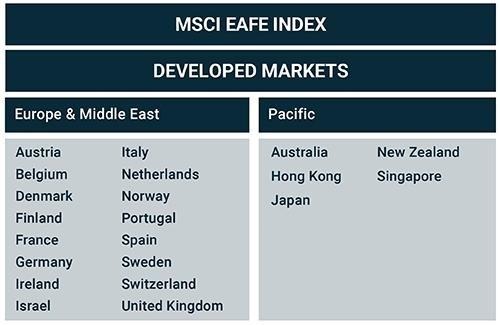
Source: MSCI
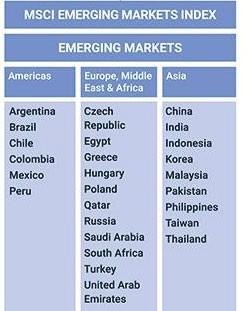
The MSCI Emerging Market Index consists of stocks of companies domiciled in developing countries that meet minimum requirements for liquidity and stability set by the index committee. The index is capitalization-weighted, which results in the five largest countries – China, South Korea, Taiwan, India and Brazil – accounting for over 70% of the index.
The MSCI Emerging Market Small Cap Index contains over 1600 constituents and represents the performance of smaller companies within emerging markets.
Index Definitions: Fixed Income & Other
Indexes are not available for direct investment
Index performance is presented for illustrative purposes and not intended to imply the performance of any fund or investment. Index performance assumes reinvestment of all income.
Bloomberg Bond Indexes
The Bloomberg US Aggregate Index measures the investment grade, US dollar-denominated, fixed-rate taxable bond market. The index primarily consists of US Government Bonds, Corporate Bonds and Agency Mortgage-Backed Securities. Other asset-backed securities comprise a smaller portion of the index. The index has an intermediate term duration, which averaged 4.8 years over the period from January 1989 through December 2018.
The Bloomberg US Intermediate Government / Credit Index consists of US Government and Corporate bonds with maturities between one and ten years The Bloomberg US Government / Credit Index 1-3 Years consists of US Government and Corporate bonds with maturities between one and three years
The Bloomberg US Municipal Index covers the investment grade US tax-exempt bond market. Various sub indexes cover bonds in this index with specific maturityranges. When a single year is listed in the index name, the index includes onlybonds with a maturity within one year of that maturity. For example, the Bloomberg US Municipal 5 Year Index contains all bonds in the Bloomberg US Municipal Index that mature within 4-6 years.
The Bloomberg US Corporate High Yield Index consists of non-investment grade dollar-denominated corporate bonds
Other Indexes
The Alerian MLP Index is a modified capitalization-weighted index of the 50 largest publicly traded MLPs and LLCs that earn the majority of their cash flow from midstream energy. Company weights are modified if the raw capitalization weight would exceed 10% so that the largest index weights remain close to 10%.
The S&P US Preferred Stock Index consists of preferred stocks that trade on major US stock exchanges. The index does not include institutional preferred issues which trade over-the-counter like bonds.
The DJ Brookfield Global Infrastructure Index tracks companies worldwide that are owners and operators of pure-play infrastructure assets. To be included, a company must have at least 50% of cash flows derived from Airports, Electricity Transmission & Distribution, Toll Roads, Midstream Energy, Ports, Water or Communications.
The Wilshire US Real Estate Securities Index consists of US publicly-traded real estate securities, including Real Estate Investment Trusts (REITs) and real estate development companies. Mortgage REITs, real estate finance companies, land companies and timber are excluded from the index.
Risk Factors for Private Equity and Real Estate Investments
- Limited Operating History – The fund has a limited operating historyupon which to evaluate the performance of the management team. The past performance of the fund and/or its principals should not be relied upon as an indication of future results.
- Business Dependent upon Key Individuals – Authority for investment decisions is delegated to a few individuals for whom there is no guarantee of their continued participation in the fund.
- Absence of Regulatory Oversight – The fund is not registered under applicable US securities regulatoryauthorities.
- Limited Liquidity – An investment in the fund is not liquid and withdrawals of invested capital are generallynot possible.
- Liability to Meet Capital Commitments – The fund’s subscription agreement constitutes a binding contract to meet the committed capital when called bythe manager. Failure to meet these obligations mayresult in civil penalties.
- General Investment Risks – The fund is subject to the general economic, regulatory, geopolitical and liquidityrisks of investing in equity and debt securities. Furthermore the fund’s investments maybe subject to commodityprice risk. Any of these factors could potentiallylead to a complete loss of invested capital.
- Risks of Illiquid Investments – The fund’s investments are not readily saleable. Investments generallyare dependent upon events beyond the control of the manager for liquidity.
- Possible Lack of Diversification – The fund may make concentrated investments with a substantial portion of the net asset value subject to idiosyncratic risk factors such as bankruptcy, lawsuits and geopolitical factors.
- Income Tax – The fund issues an annual K-1 which reports each investor’s share of the fund’s gains and losses. Investors maynot be able to deduct expenses against income and reported gains and delays in issuing the K-1 may cause investors to file late.
Potential Additional Risks (see fund description to see which are applicable)
A. Leverage – The fund may employ leverage which will magnify the potential gains and losses from its investments. Generallyleverage will be tied to individual investments without recourse to the fund’s other investments, but there are no assurances that assets will not be cross collateralized.
B. Foreign Investments – The fund invests outside the US and be subject to political and regulatory risk.
C. In-Kind Distributions – The fund reserves the right to make distributions of securities in-kind. Investors may incur substantial costs in liquidating these securities.
D. Unrelated Business Taxable Income – The fund’s investments may generate Unrelated Business Taxable Income which is ordinarily taxable to non-profit corporations and trusts at applicable corporate income tax rates. Unrelated Business Taxable Income may have serious adverse tax consequences for Charitable Remainder Trusts.
E. Potential Non-Resident State Income Tax Liabilities – The fund’s investments may generate income taxable at the state level to investors who are not residents of that state.
This list is not a complete list of all the potential risks related to investments in private equity and real estate funds. Potential investors should read the fund’s Private Placement Memorandum and Limited Partnership Agreement for a more complete discussion.
Risk Factors for Hedge Fund Investments
- Limited Operating History – The fund has a limited operating history upon which to evaluate the performance of the management team. The past performance of the fund and/or its principals should not be relied upon as an indication of future results.
- Business Dependent upon Key Individuals – Authority for investment decisions is delegated to a few individuals for whom there is no guarantee of their continued participation in the fund.
- Absence of Regulatory Oversight – The fund is not registered under applicable US securities regulatoryauthorities.
- Limited Liquidity – An investment in the fund is not liquid and withdrawals are only available per the terms of the limited partnership agreement.
- General Investment Risks – The fund is subject to the general economic, regulatory, geopolitical and liquidity risks of investing in equity and debt securities. Additionally, fund’s investments maybe subject to commodity price risk. Any of these factors could potentially lead to a complete loss of invested capital.
- Risks of Illiquid Securities – The fund’s investments maynot be readily saleable. Investments maybe dependent upon events beyond the control of the manager for liquidity.
- Possible Lack of Diversification – The fund may make concentrated investments with a substantial portion of the net asset value subject to idiosyncratic risk factors such as bankruptcy, lawsuits and geopolitical factors.
- Income Tax – The fund issues an annual K-1 which reports each investor’s share of the fund’s gains and losses. Investors maynot be able to deduct expenses against income and reported gains and delays in issuing the K-1 may cause investors to file late.
Potential Additional Risks (see fund description to see which are applicable)
A. Master-Feeder Fund Structure – The fund utilizes a master-feeder structure, commingling onshore and offshore investors into a single master fund. The assets of the master fund are held offshore and are outside the prevue of US securities regulation.
B. Short Sales – The fund has the ability to sell securities short, meaning securities are borrowed from a broker dealer and sold in the open market. The fund retains a liability to deliver the securities back to the broker, requiring the manager to purchase the securities at current market prices. As price increases can exceed 100%, the potential losses can be greater than the initial investment. Generally the manager will limit the size of individual short positions to mitigate this risk, but there can be no guarantees that this policy will be followed at all times.
C. Derivatives – The fund may engage in derivative transactions, potentially including, but not limited to, futures, options, swaps and credit default swaps. Derivatives can enable excessive amounts of portfolio leverage and create the potential for large losses.
D. Leverage – The fund may employ leverage which will magnify the potential gains and losses from its investments.
E. Foreign Securities – The fund invests in securities listed on non-US exchanges that are not subject to US regulatory requirements on reporting and other measures designed to protect investors.
F. In-Kind Distributions – The fund reserves the right to meet redemption requests with distributions of securities in-kind. Investors mayincur substantial costs in liquidating these securities.
G. Unrelated Business Taxable Income – The fund’s investments may generate Unrelated Business Taxable Income which under most circumstances is taxable to non-profit corporations and trusts at applicable corporate income tax rates. Unrelated Business Taxable Income mayhave serious adverse tax consequences for Charitable Remainder Trusts.
H. Assets Held in “Street Name” in Brokerage Account – The fund utilizes a brokerage account for custody of its assets which are held in the broker’s name and is at risk should a bankruptcy of the broker occur. A complete or partial loss of the fund’s assets is possible.
I. Potential Non-Resident State Income Tax Liabilities – The fund’s investments may generate income taxable at the state level to investors who are not residents of that state.
The term “hedge fund” commonly refers to private investment partnerships whose predominant activity is investing in marketable securities and actual hedging of investment positions may not occur. This list is not a complete list of all the potential risks related to investments in hedge funds.
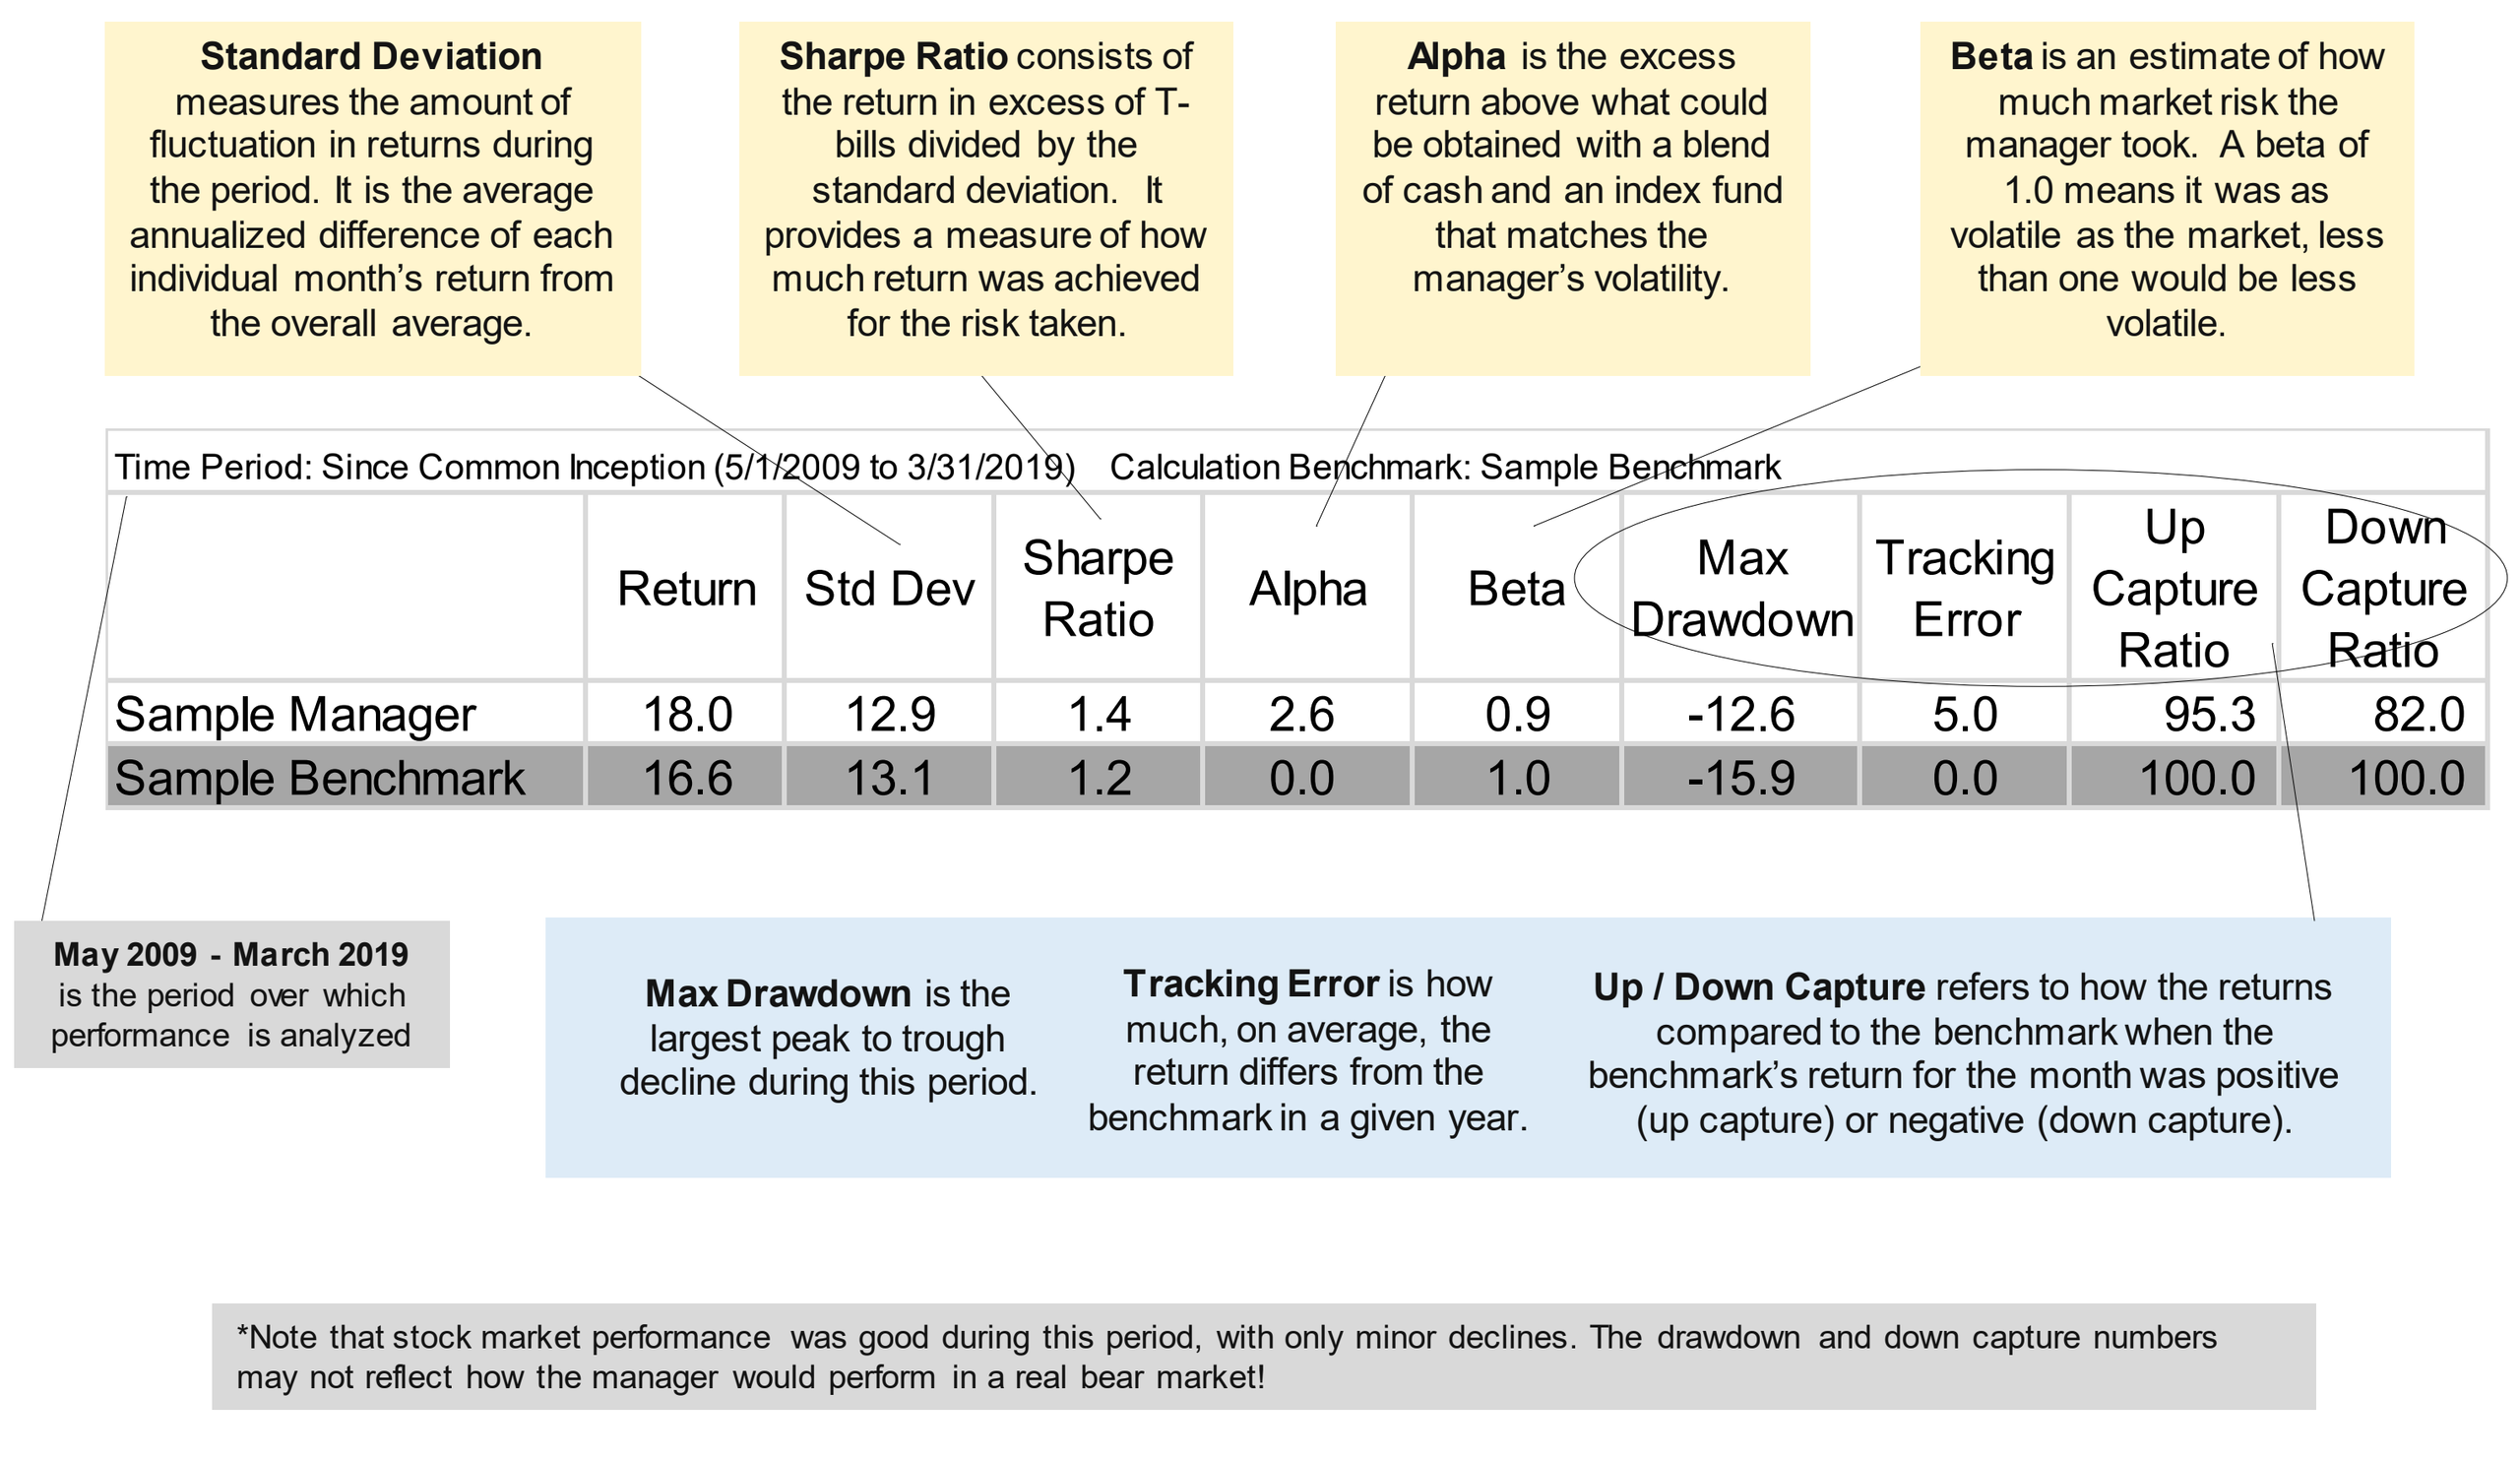
What do all these performance numbers mean?
Past performance is not a guarantee or reliable indicator of future results.