The Importance of Small Cap Stocks in a Diversified Portfolio
Small cap stocks, as defined by the popular, but flawed, Russell 2000 Index comprise approximately 6% of the total US market today. The record outperformance of large cap names over the past decade led many to neglect the role these companies can play in a diversified portfolio. US small cap stocks are only small businesses relative to the giant multinational companies that dominate the S&P 500. The average company in the Russell 2000 Small Cap Index generated over $2.6B in sales last year, employs thousands of employees and has a market capitalization around $1.5 billion. While the financial press speaks of private equity replacing publicly traded small cap stocks in endowment portfolios, only the largest ‘mega-buyout’ private equity funds possess the ability to invest in businesses the size of a typical publicly traded small cap stock.
Impact of Recent Legislation on Small Cap Stocks
Current macro trends can potentially create a benign environment for these companies. The Inflation Reduction Act (IRA) and the Infrastructure Investment and Jobs Act (IIJA), passed in 2021, promised nearly $700 billion in infrastructure, research, and related programs. Over $500 billion of this amount targets infrastructure construction while the remainder primarily focuses on the electrification of transportation. Combined with the Creating Helpful Incentives to Produce Semiconductors (CHIPS) Act, a sustained flow of funds stands to support America’s industrial economy. The recent collapse of the Francis Scott Key Bridge in Baltimore brought focus to the issues of the country’s aging infrastructure, however the needs for America’s power infrastructure are greater.
The demands of artificial intelligence and growth of technology are creating increased demand for data centers and a corresponding demand for electric generation and investment in updating the power grid. Reshoring of US manufacturing also creates new demand for power. After a decade of 0.5% growth in US electricity demand, recent FERC projections increased their five-year projection of power demand growth rate to 4.7%. Power industry consulting firm Grid Strategies believes even this is an underestimate1 and advises that the power grid will need significant investment to handle this load growth.
With these factors leading the US economy to reaccelerate after the 2022-2023 slowdown, the environment may improve for US small and midcap stocks. The last time small cap outperformed the S&P 500 over three calendar years was the 2010-2012 period.
The Russell 2000 is a bad index
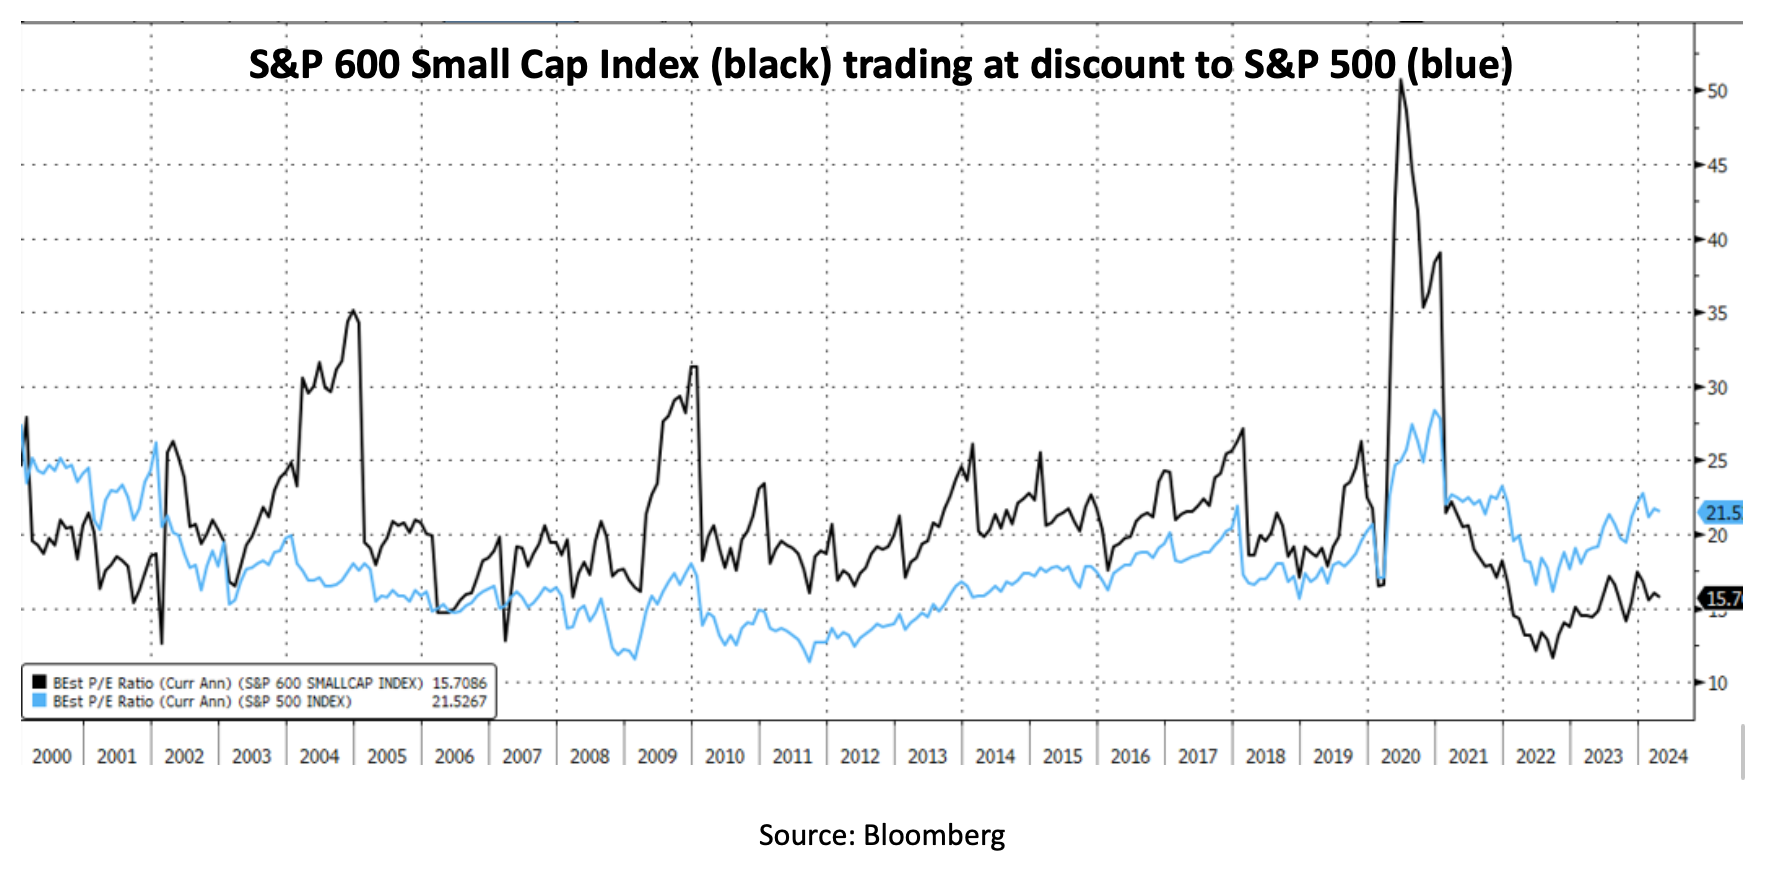
The forward P/E ratio of Russell 2000, the most widely used small cap benchmark, stood at 27.4 at quarter end, well above the 21.7 P/E ratio of the S&P 500. While this gives the impression that small caps stocks are more expensive than large caps (and small caps have traded at valuation premiums in the past due to higher growth expectations), investable small cap stocks trade at a discount to the S&P 500. Approximately 40% of the market cap of the Russell 2000 consists of unprofitable companies. The losses of these companies are aggregated with the earnings of the profitable 60% of the index, resulting in a higher P/E ratio. The Russell 2000 construction methodology is simple: the 3,000 largest stocks by market cap form the Russell 3000 and the Russell 2000 Small Cap Index consists of the bottom 2,000 of this group. A toxic waste dump of speculative biotech stocks, unprofitable tech companies and failing, distressed businesses exists within this bottom 2,000. While currently at an elevated level, the weighting of unprofitable companies in the index typically falls in the 30-40% range. Fortunately, a better small cap index exists that better reflects the investment opportunities available in the asset class. The S&P 600 Small Cap Index avoids the issues of the Russell 2000 by requiring positive earnings over the past four quarters and 6-12 months before initial public offerings (IPOs) can be included in the index. As a result, the P/E ratio of the S&P 600 is not distorted by negative earnings and reveals that profitable small cap stocks traded at a forward P/E ratio of 16.0 on March 31, the largest discount since 1999. The weight of the Russell 2000 within the Russell 3000 index has been declining over the past 10 years, reaching a record low of 6.0% last year, further reflecting the current valuation discount for smaller companies.
What about midcaps?
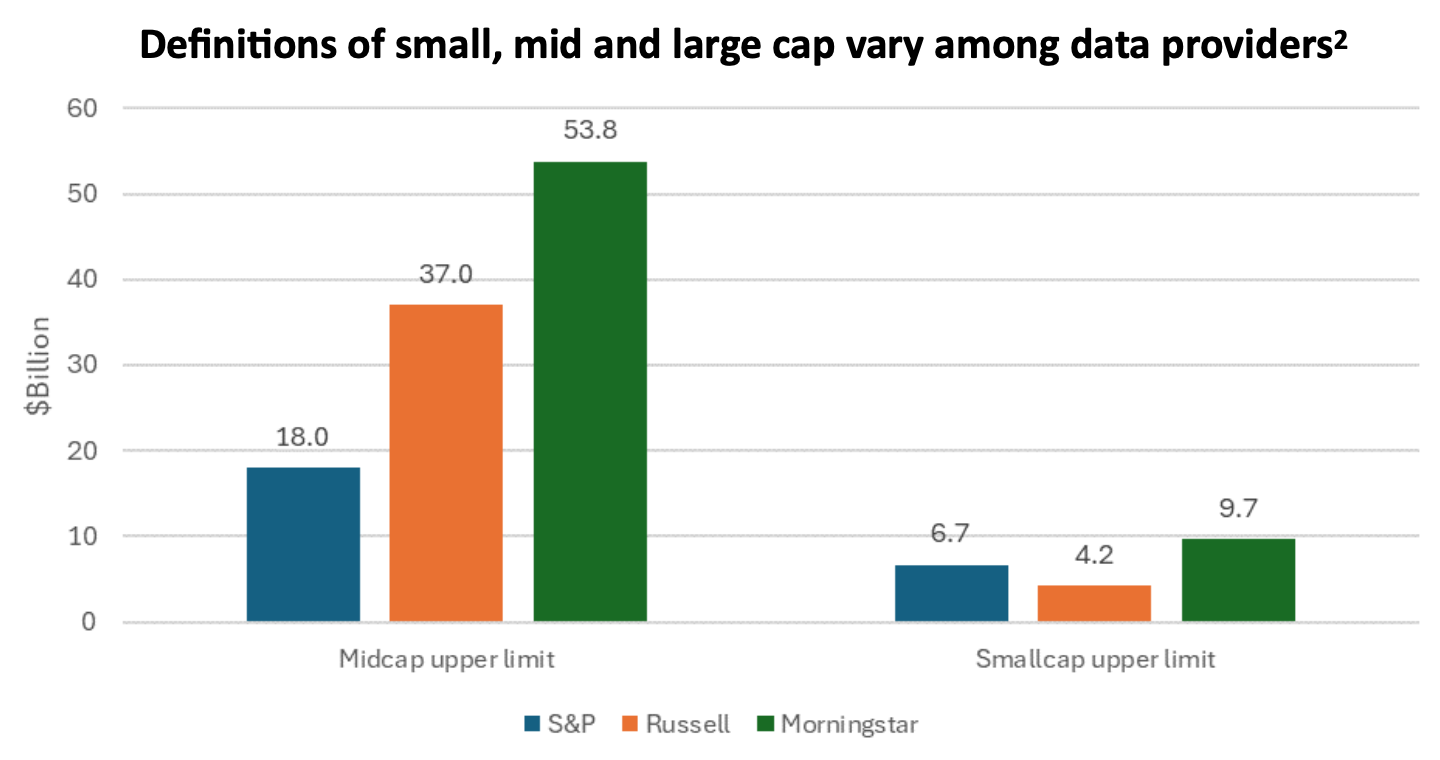
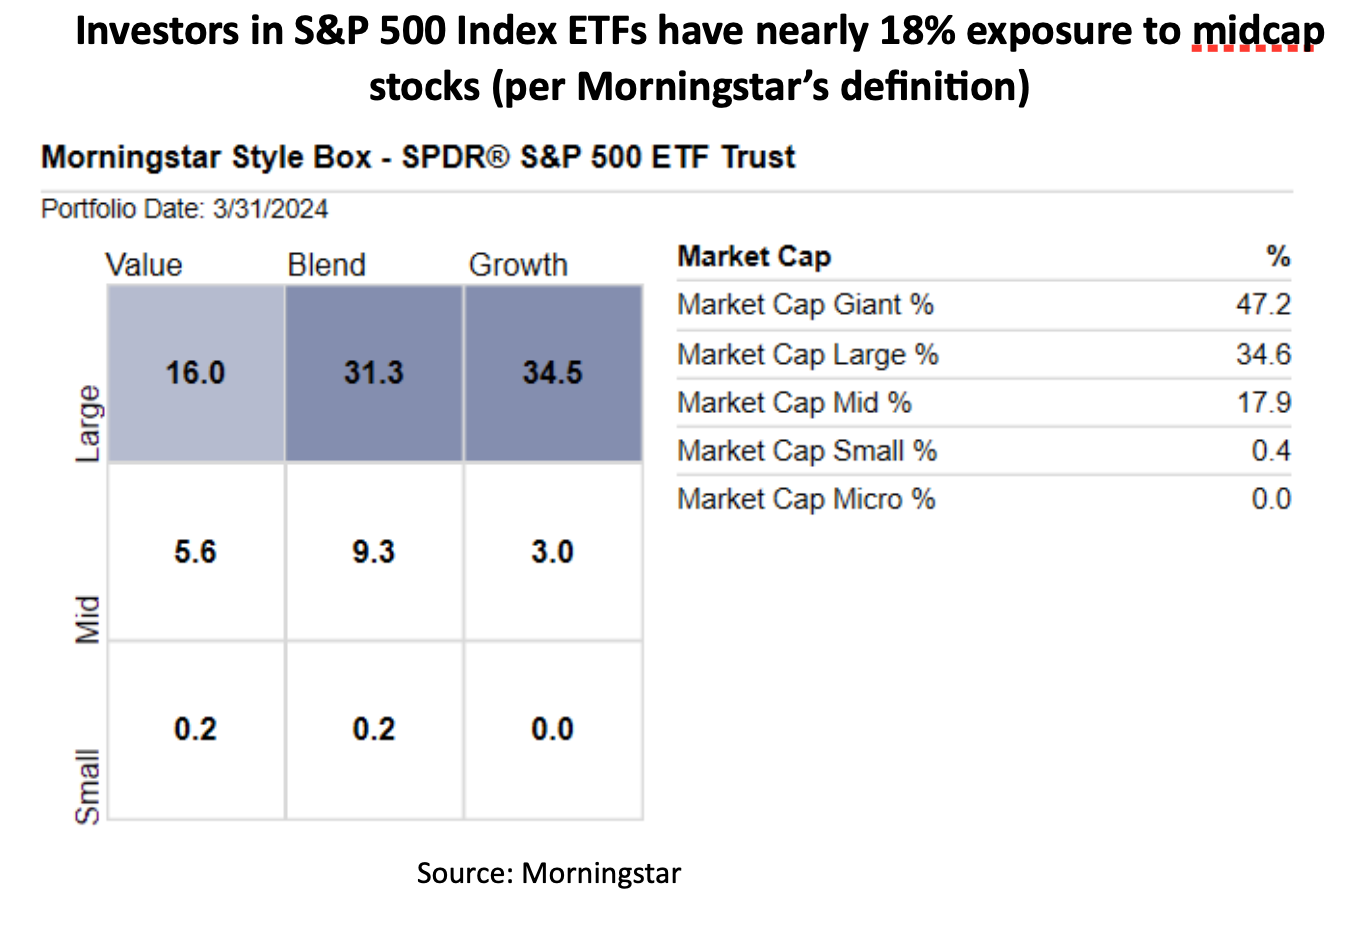
The financial press and investment industry create a false impression that small, midcap and large cap stocks are distinct, easily classifiable asset classes. In reality, the definitions are murky and subjective. The three major classifiers – Russell, S&P and Morningstar, significantly disagree on the cutoff levels between large, mid and small cap. Moreover, using any of these definitions, large cap indexes such as the S&P 500 or Russell 1000 contain a substantial weight in midcap stocks. For Russell, the entire Russell Midcap index is contained within the Russell 1000 Large Cap index, as Russell simply defines midcap as the bottom 800 names of the Russell 1000. Because these companies are a fraction of the size of a typical large cap stock, these 800 names generally comprise about a quarter of the index. Russell defines the largest 200 US public companies as large cap, which implies that 300 names in the S&P 500 are midcap by that definition. The S&P 400 Midcap index would then overlap with the smaller names in the Russell Midcap. Morningstar utilizes higher market cap cutoffs than either Russell or S&P. According to Morningstar, midcap stocks have market capitalizations between $9.7 billion and $53.8 billion, whereas Russell’s definition is $4.2 billion to $37.0 billion2. Moreover, whichever definitions one chooses, typical market volatility guarantees stocks with valuations near the cutoff points could fluctuate between capitalization categories daily. While midcap companies can make great investments, a close look at current holdings is warranted to determine if additional, dedicated midcap exposure is warranted.
A passive investor in the S&P 500 or Russell 1000 will obtain adequate exposure to midcap stocks, requiring only an allocation to small cap if they wish to capture the whole US market. Active large cap managers often cover a similar range of company sizes. Active small cap managers tend to let stocks appreciate into midcap territory, creating additional overlap.
Historical Performance and Future Outlook for Small Cap Stocks
The last time small cap stocks traded at a comparable discount to large cap was during the technology boom of the late 1990s. This period was followed by a decade of outperformance relative to the S&P 500. Infrastructure investments, reshoring and competitive energy costs can provide a secular tailwind for smaller US companies. As small caps, even higher quality ones, exhibit greater cyclicality and financial risks, they should remain a modest allocation in most portfolios.
- https://gridstrategiesllc.com/wp-content/uploads/2023/12/National-Load-Growth-Report-2023.pdf ↩︎
- S&P: https://www.spglobal.com/spdji/en/documents/methodologies/methodology-sp-us-indices.pdf
Russell: https://www.lseg.com/content/dam/ftse-russell/en_us/documents/other/2023-russell-recon-recap-final.pdf
Morningstar: Morningstar Direct ↩︎